The Dashboard is your home base for measuring progress and checking your stats.
Progress Widget
At the top is the Your Progress So Far widget. This tracks three metrics:
- The percent of MBE questions available that you have answered -- correctly or not -- so far.
- The average percent of MBE questions available that the other students in your bar exam session have answered so far.
- The most questions any one student in your bar exam session has answered.
Date Range Widget
Below the progress widget is the Date Range widget, which controls the display of data in the two graphs below.
Line Charts Widget
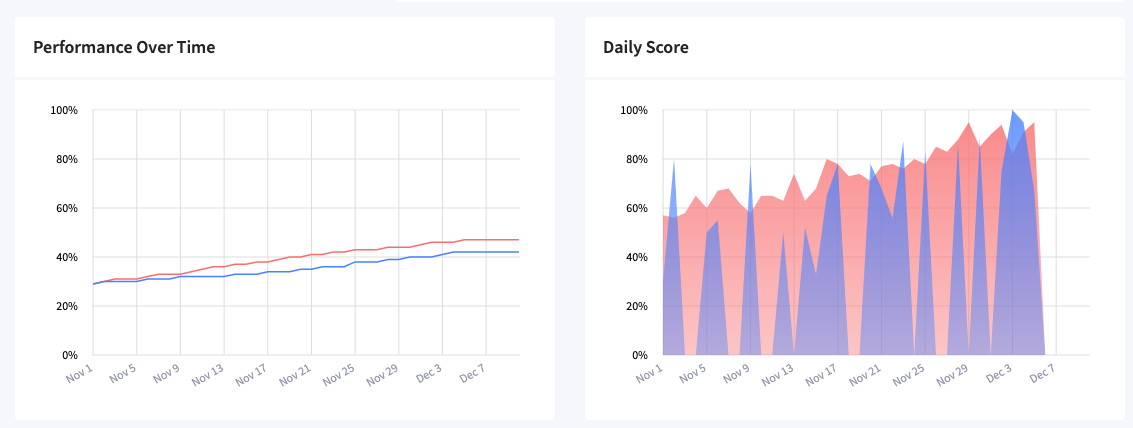
Below the date range picker are the two charts controlled by the date range, Performance Over Time and Daily Score.
Each chart shows both your metrics, in blue, and an average metric for your bar exam session, in red. If you would prefer not to see the comparative stats, click "Disable Comparative Charts."
Performance Over Time Line Chart
Performance over time is a running average of your performance on MBE questions. As such, it will only change gradually as your score improves with practice.
Daily Score Line Chart
The daily score is your performance on MBE questions on each day. If you did not practice on a day, there will be no data for that day.
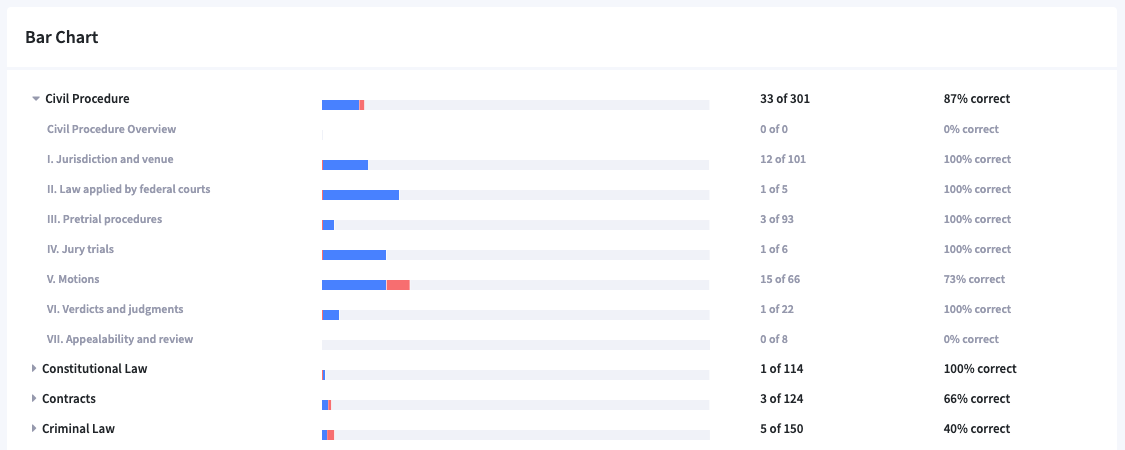
Bar Chart Widget
The bar chart widget shows total questions answered by subject and subject section, as well as the percent correct/incorrect for each.
To see the subject sections, click the arrow next to the subject name to open the accordion.
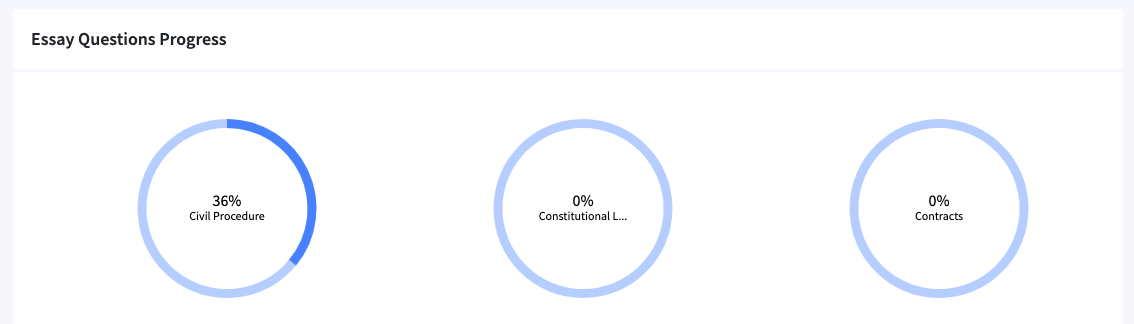
Essay Progress Widget
For active One-Timers students, the Essay Progress widget at the bottom of the dashboard shows your progress in answering essay questions. When you mark an essay question "complete" in the Classroom Essays section, it fills in part of the pie charts here.